Logistics & Shipments
Management Dashboard
Visualization by: Gbolahan Adebayo
Date: July, 2024
Type: Business Dashboard
Link to Visualization: Click Here
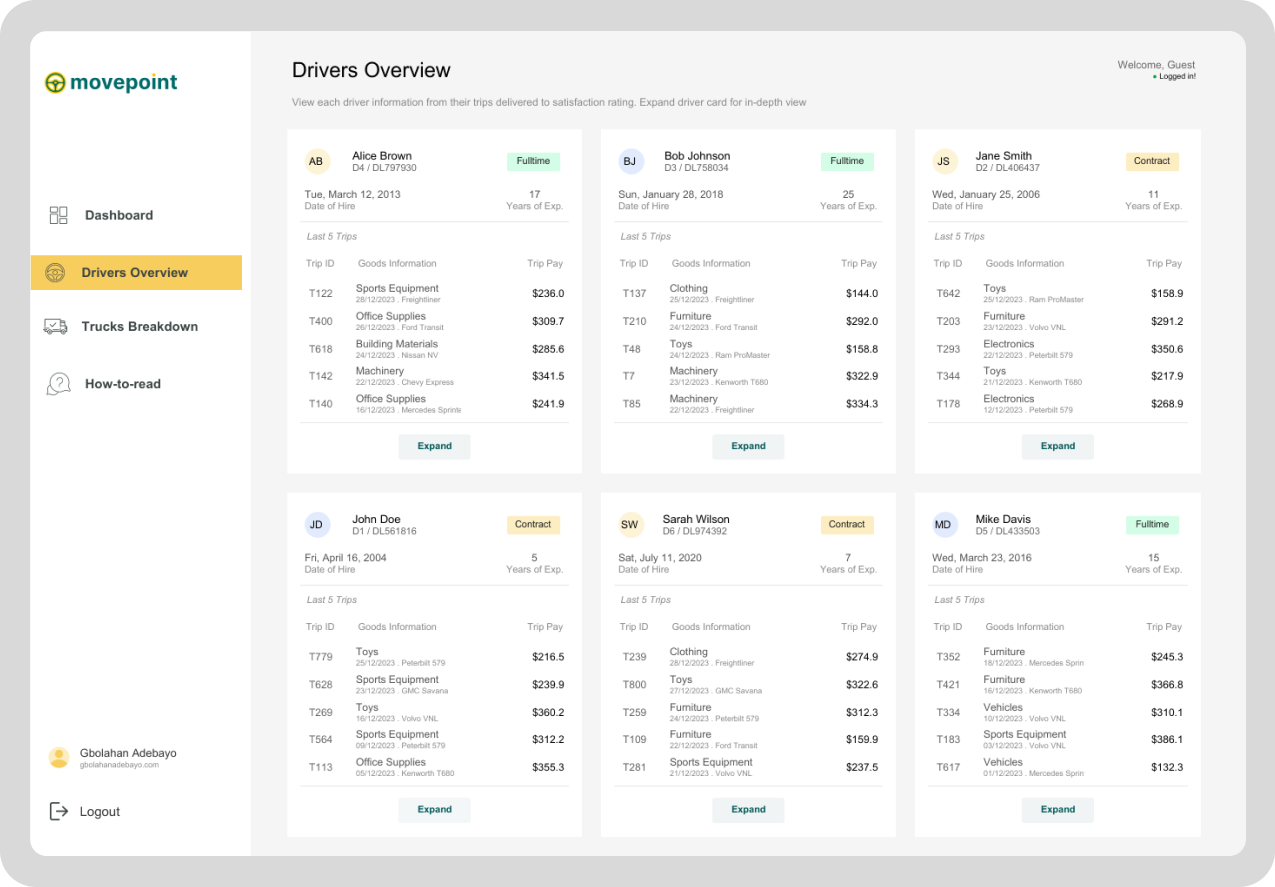
The “Drivers Overview” dashboard serves as a comprehensive tool for tracking driver performance, starting with a summarized home page that displays key details for each driver in a card layout. Each card provides information such as the driver’s name, ID, employment status (e.g., full-time, contract), hire date, years of experience, and their last five trips, including trip IDs, goods delivered, and trip pay. Users can click the “Expand” button on any driver’s card to access a more detailed view. The expanded view, as shown for Alice Brown, reveals a deeper breakdown of the driver’s performance, including personal details like contact information, ratings, years of experience, total pay, and last delivery date. It also presents key performance metrics such as the number of deliveries, total trip earnings, average delivery time, and customer satisfaction ratings, with comparative rankings against other drivers. Additionally, a detailed trip log table provides insights into each trip’s specifics, including delivery locations, vehicle IDs, delivery conditions, times, and earnings.
This seamless transition between the overview and detailed insights makes the dashboard highly intuitive and actionable for stakeholders, enabling quick navigation and thorough analysis.
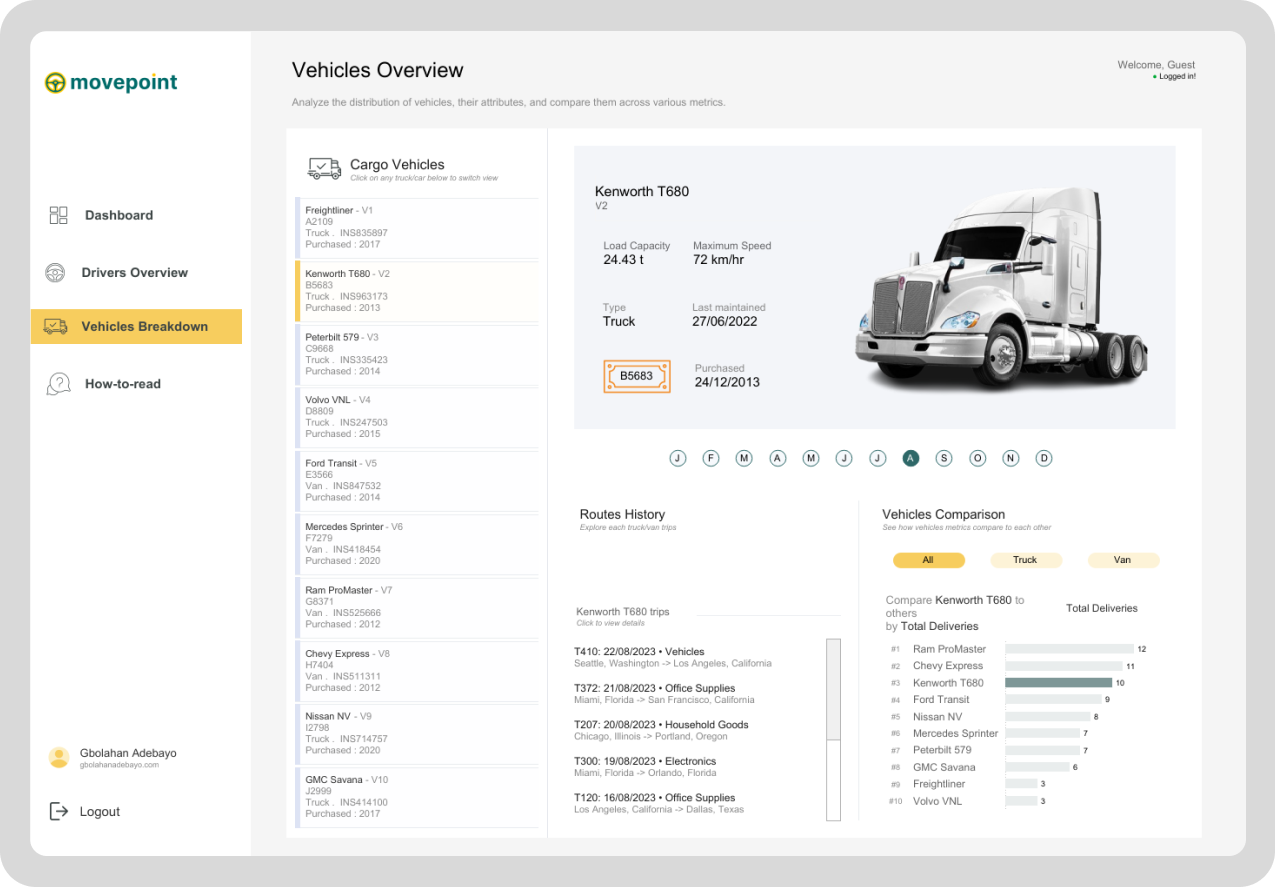
The “Vehicles Overview” dashboard provides a detailed analysis of the distribution, attributes, and performance of cargo vehicles within the fleet. On the left panel, a list of vehicles is displayed, categorized by their type (e.g., truck or van), along with their unique identifiers, purchase year, and insurance details. When a specific vehicle, such as the Kenworth T680, is selected, detailed information appears in the central panel. This includes key specifications like load capacity, maximum speed, type, last maintenance date, and purchase date, accompanied by a visual representation of the vehicle. Below this, the “Routes History” section offers a chronological view of trips completed by the selected vehicle, providing insights into metrics such as distance covered, fuel usage, and load size, with detailed trip locations for each route. On the right-hand side, the “Vehicles Comparison” section allows users to benchmark the selected vehicle’s performance against others in the fleet. Metrics such as total deliveries, segmented by vehicle type (truck or van), are displayed, offering a comparative view of operational efficiency.
This interactive layout enables users to switch between vehicles seamlessly, analyze their performance, and identify areas for optimization, making the dashboard an essential tool for effective fleet management.